本文主要介绍正态分布、拉普拉斯分布等常用分布拟合的理论推导以及代码实现。
理论推导
假设数据独立同分布。对于任意数据点${x_i}$,对应概率密度为$f({x_i})$,最大似然函数:
表示成参数,并写成对数形式:
正态分布
对于正态分布:
求偏导得参数估计:
拉普拉斯分布
对于拉普拉斯分布:
由于其概率密度曲线为对称分布,因此均值估计可用统计均值直接表示:
最大似然函数求偏导,得出b的估计:
对数正态分布
对数正态分布:
事实上,令$t = \ln x$,则参数求解与正态分布完全一致。
瑞利分布
瑞利分布:
最大似然求导,得出参数估计:
代码实现
正态分布
1 | x = x(:); % should be column vectors ! |
拉普拉斯分布
1 | x = x(:); % should be column vectors ! |
对数正态分布
1 | t = log(x(:)); % should be column vectors ! |
瑞利分布
1 | x = real(x(:)); % should be column vectors ! |
应用举例
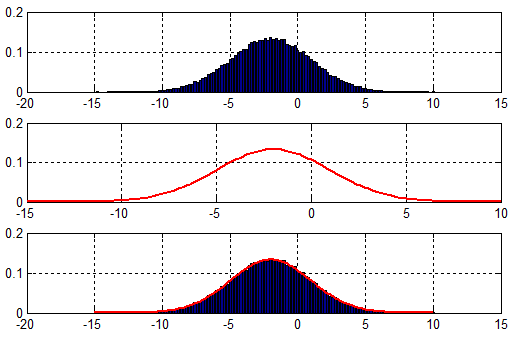
以正态分布为例:
rng('default') % for reproducibility
x = 3*randn(100000,1)-2;
%fitting
x       = x( : );                 % should be column vectors !
N       = length(x);
u       = sum(x)/N;
sig2    = (x-u)'*(x-u)/N;

%Plot

figure;
%Bar
subplot 311
numter = [-15:.2:10];
[histFreq, histXout] = hist(x, numter);
binWidth = histXout(2)-histXout(1);
bar(histXout, histFreq/binWidth/sum(histFreq)); hold on;grid on;
%Fitting plot
subplot 312
y = 1/sqrt(2*pi*sig2)*exp(-(numter-u).^2/2/sig2);
plot(numter,y,'r','linewidth',2);grid on;

%Fitting result
subplot 313
bar(histXout, histFreq/binWidth/sum(histFreq)); hold on;grid on;
plot(numter,y,'r','linewidth',2);
结果图:
